


GPS-Based Training Load Management in Professional Football: A Practitioner's Framework

In Turkish professional football, the relationship between sport science and coaching follows a hierarchy I have found consistent at every level I have worked: football comes first, sport science is there to support it. This is not a trivial distinction. It determines which metrics get prioritized, how feedback is framed for players and technical staff, and how decisions are made when data and coaching intuition point in different directions. The aim is not to impose data on the game, but to use it in ways that improve outcomes for everyone involved.
Working simultaneously as a UEFA A-licensed coach, a university sport science lecturer, and an athletic performance coach in Turkish SuperLig, I have always had to bridge theoretical knowledge with the practical realities of elite football. In Turkey, that means a minimum of 50 competitive matches per season across the domestic league, the Turkish Cup, and European competition. In that context, the performance department works toward two core objectives: optimizing individual and team performance, and protecting player availability. Every monitoring decision, every load target, and every recovery protocol follows from those two priorities.
The Demands of Modern Football
The physical profile of professional football has changed substantially over the past decade, and so have the parameters practitioners track most closely. Where coaches once focused primarily on total distance covered per match — typically 10 to 13 kilometers for outfield players — attention has shifted toward high-intensity running. Modern elite footballers cover between 800 and 1,200 meters of high-speed running per match, defined as running above 20 km/h, and sprint volumes above 25 km/h have become a key performance differentiator (Gualtieri et al., 2023). Accelerations and decelerations represent a substantial component of match load beyond velocity-based metrics, with high-intensity efforts accounting for between 5 and 10% of total player load in elite contexts (Dalen et al., 2016; Harper et al., 2019).
This intensity profile narrows the margin between optimal loading and overloading. An injured player is unavailable, and that absence carries both competitive and financial costs. Clubs in Turkey and across Europe have increasingly tried to quantify this: the consequences of injury extend beyond treatment expenses to reduced match performance, squad depth, and effects on group cohesion. At the highest levels, the argument for systematic load management has become as much economic as scientific.
GPS Technology in Football: External Load Variables
At the operational level, load management depends on capturing both external load — the physical output the athlete produces — and internal load — the physiological response that output generates. GPS technology is the primary tool for external load monitoring, supplemented by heart rate monitoring and subjective measures for internal load.
The workflow is consistent across every training day. Before the session, players receive GPS devices integrated into vests or attached beneath the training kit. Once activated, a live tracking dashboard shows real-time data on the pitch. The session is organized into clearly labeled drills — warm-up, rondo, small-sided game, position-specific work — each categorized individually within the software, so that post-session analysis can break total workload into its component parts. Several GPS platforms are used across European football — Catapult, Statsports, GPSports, PlayerTek, Polar Team — and while their interfaces differ, the core metrics they capture are broadly comparable.

The external load variables tracked daily include total distance for overall volume, high-speed running distance above 20 km/h, sprint distance above 25 km/h, maximum speed reached within the session, high-metabolic load distance accounting for accelerations that demand energy output disproportionate to velocity, acceleration and deceleration counts by intensity zone, player load as a composite metric derived from triaxial accelerometer data, and running symmetry — the balance between left and right foot loading across the session.
Running symmetry is worth particular attention, and also some caution. An asymmetry exceeding 10% between sides is treated as a clinical flag requiring follow-up — the same threshold applied in lower-limb asymmetry research (Glassbrook et al., 2020) — and work in professional football has identified associations between GPS-measured running symmetry and both performance metrics and injury risk indicators (Tarakci et al., 2025). The wider evidence is less settled: a systematic review of 31 studies found the relationship between lower-limb asymmetry and injury risk to be inconsistent, with overall evidence quality rated moderate to low (Helme et al., 2021). It is also worth being explicit about what the variable measures. A torso-mounted unit records loading after the impact has travelled through the joints and tissues of the lower limb, so running symmetry derived from GPS is an indirect proxy for lower-limb loading rather than a direct measure of it. Chronic asymmetry in loading patterns may nevertheless precede soft tissue injury, and tracking it longitudinally gives medical and physiotherapy staff early signals that a player may be compensating for discomfort before they report any symptoms. The value of this variable is not in any single session reading but in the pattern it reveals over several weeks.
Internal Load: RPE and Physiological Response
External load describes what the body produced; internal load describes the physiological cost of that output. These two dimensions do not always move together — the same session can impose very different physiological stress on two players with different aerobic capacities, training histories, or recovery states. Monitoring both gives a more complete picture of adaptation and fatigue than either dimension alone.
The most widely used internal load tool remains the session RPE (Rating of Perceived Exertion), collected between 10 and 50 minutes after session completion (Foster et al., 2021). The method has been validated across a wide range of athletic populations and sporting contexts (Haddad et al., 2017), and is well established in professional football specifically (Rago et al., 2020). Players rate their perceived effort on a 0-to-10 scale, and that number is multiplied by the session duration in minutes. A player who rates an 80-minute session at 5 produces an internal load score of 400 arbitrary units (AU). Tracked across weeks and months, useful patterns emerge. A sustained drop in RPE despite stable external load may indicate genuine adaptation or, in some cases, early overreaching. Acute rises in RPE relative to the external load suggest that a player's physiological cost is elevated and recovery should be monitored closely.
Heart rate data — specifically time spent in intensity zones expressed as percentages of maximum heart rate — is collected alongside RPE. Sleep quality ratings and subjective wellness questionnaires fill out the internal load picture. Together, these variables allow the performance department to compare what was required of each player with what it cost them, and to read both figures in relation to their position in the weekly and seasonal cycle.
The Acute:Chronic Workload Ratio
The framework that connects daily load monitoring to injury prevention is the Acute:Chronic Workload Ratio (ACWR), based on the work of Gabbett (2016). The principle is straightforward: injury risk is not simply a function of how much load was done this week, but of how this week's load compares to the load accumulated over the preceding several weeks.
The acute load represents the total training and match stress of the current week. The chronic load represents the average weekly stress over the preceding three to four weeks — a measure of the athlete's conditioning base and their capacity to absorb work. The ratio of these two values gives an index of relative stress: how much has been asked of the athlete this week relative to what they have been consistently doing.
Research identifies an optimal range — often described as the "sweet spot" — at an ACWR between 0.8 and 1.3 (Gabbett, 2016). Players within this range are receiving enough stimulus to maintain and develop fitness without exceeding their adaptation capacity. An ACWR below 0.8 suggests underloading — the athlete is below their usual training stimulus and may be losing conditioning or failing to benefit from the supercompensation effect. An ACWR above 1.3 is associated with elevated injury risk, and values at or above 1.5 are considered high-risk territory.
The ratio has not gone unchallenged. Its predictive validity at the individual level is limited, and the conventional coupled calculation has been shown to produce spurious correlations between workload and injury as a mathematical artefact rather than a physiological signal (Lolli et al., 2017; Impellizzeri et al., 2020a, 2020b). This does not make the measure useless in practice, but it does change what can reasonably be asked of it: it is a descriptive index of how the current week compares to recent weeks, not a predictor of who will get injured.
At Başakşehir, the ACWR was monitored individually for each player and reviewed in weekly multidisciplinary meetings with athletic performance staff, physiotherapists, medical staff, and nutritional support. The ratio was not applied as a fixed rule — interpretation always depends on context — but it gave a consistent, objective reference point for discussion.
Weekly Structure: Planning Around Match Days
Translating ACWR targets into a coherent weekly training plan requires a periodization model organized around match days. The standard convention uses MD-x notation — match day minus x — to indicate each session's position in the cycle.

At MD-4 and MD-3, training emphasis is on high and moderate intensity work. This is where most of the week's accumulated load is generated. Sessions include medium to large small-sided games, conditioning elements, and targeted physical work with accelerations, decelerations, and directional changes. At MD-2, intensity remains moderate but volume begins to drop. At MD-1, the session moves to low-intensity, low-volume work focused on neuromuscular priming, sharpness, and tactical preparation — so that players arrive at match day in good condition and ready to compete.
Drill selection is not incidental to load planning. A 5v5 game on a 40×30-meter pitch produces a different load profile than an 8v7 tactical exercise on a larger area. Departments that manage load carefully maintain drill books — catalogued collections of exercises with documented average load outputs — which allow realistic planning before the week begins and accurate attribution during post-session analysis. If a session is designed to produce 500 meters of high-speed running and the tracked output is 700 meters, that difference is factored into ACWR calculations for the following days.
Individualization within the team structure runs through a two-tier system. Level 1 protocols — standard metric targets — apply to all players in full training. Level 2 protocols are applied to individual players who need modified loads due to return from injury, age-related recovery considerations, or specific ACWR flags. Players in rehabilitation who are not yet match-fit follow progressive re-introduction protocols based on controlled weekly load increments rather than subjective readiness estimates.
Match Reporting and Individual Benchmarks
Post-match reporting is as central to the load management system as training tracking. Within 24 hours of each match, individual player reports are prepared and distributed, showing total distance, high-speed running and sprint volumes, maximum speed, acceleration and deceleration counts, and comparisons to personal benchmarks and team averages.
In our department, a practical planning reference was a target weekly total distance of around 25 times the average individual match distance. This is a working heuristic, and clubs with different microcycle structures will arrive at different multipliers.
If a player covers 10 kilometers in a match, the weekly training accumulation target is around 25 kilometers. Players who appear for less than 30 minutes receive compensatory top-up sessions — typically box-to-box running protocols calibrated to their individual fitness level — to keep their weekly volume from falling too far below their ACWR floor. A player below 30 minutes of match time receives one set of repeated high-speed runs; below 50 minutes, two sets. This approach ensures that squad players who receive limited minutes do not drift into underloading over the course of a season.
Maximum speeds are recorded in both training and competition and maintained as individual benchmarks. Players typically reach slightly higher maximum velocities in competitive matches than in training, reflecting the intensity of competitive pressure and the reaction to opponents. Both values are used when setting percentage-based speed zones for training prescription — sessions targeting work above 85 to 90% of maximum speed are calibrated to each player's own recorded maximum, not a group average. Applying population-average thresholds to individuals systematically overloads some players and underloads others (Gualtieri et al., 2023; Murray et al., 2017).
Physical Testing and the Integrated Monitoring System
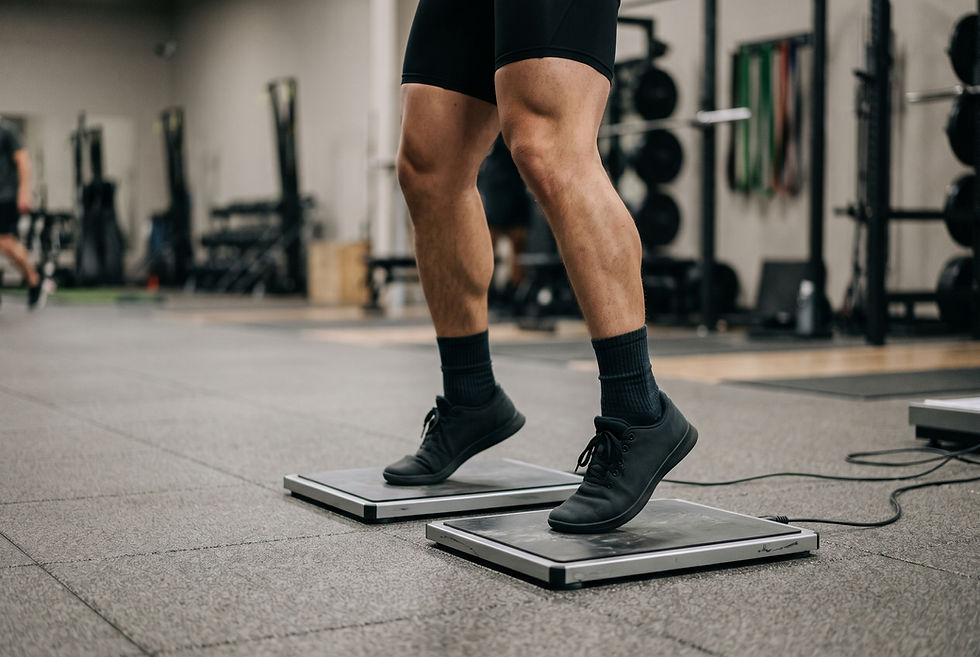
Physical testing provides the reference points against which GPS data is interpreted. At the start of preseason, players complete a battery of assessments: the Incremental Fitness Test (IFT) for aerobic capacity and lactate threshold estimation, countermovement and squat jump tests on force plates for neuromuscular profiling, isokinetic strength testing for hamstring-to-quadriceps ratio assessment, agility tests using the Illinois protocol, and body composition analysis.
Lactate threshold data from the IFT directly informs training zone thresholds. Box-to-box running prescriptions are calculated relative to each player's individual threshold speed rather than group averages. A session designed as threshold conditioning then actually operates at threshold for each player, rather than being above the threshold for some and below it for others.
The complete monitoring system integrates GPS external load data, heart rate internal load, RPE session scores, physical testing results, match tracking data, injury and availability records, and tactical performance metrics from video analysis. At Başakşehir, this dataset was visualized in Power BI dashboards with filtering by player, metric, date range, and session type. The weekly staff meeting was structured around that dashboard: any ACWR spike, any symmetry flag, or any gap between external and internal load expectations prompted a focused discussion between performance, medical, and technical staff.
The system is only as useful as the culture surrounding it. Getting players to wear devices consistently, getting coaches to engage with the data, and helping medical staff interpret GPS indicators — those processes take as much time and effort as any technical aspect of the software itself. The data is only informative if the people using it know what to do with it.
---
Frequently Asked Questions
Q: What is the difference between external and internal load, and why do both need to be tracked?
External load describes what the body physically produced — the distance covered, the accelerations performed, the speeds reached. Internal load describes the physiological cost of that output — the heart rate response, the perceived effort, the recovery demand. Two players can complete the same session with very different physiological costs depending on their fitness levels, fatigue states, and recovery histories. Tracking external load alone shows what was done; combining it with internal load shows what it cost, which is the more useful combination for managing adaptation and injury risk over time.
Q: What happens when a player's ACWR rises above 1.3 during a congested fixture period?
In a congested fixture period, ACWR spikes are common and not always preventable — the match schedule is fixed, and match load contributes to the acute total. The main response is to reduce the controllable component: training intensity and volume between matches are lowered, and Level 2 individualized protocols are applied to players with the highest ratios. Recovery work — ice baths, nutrition, sleep quality, physiotherapy — takes priority. The aim is to manage the spike while protecting the chronic base, so that the ratio returns to a safer range as soon as the schedule allows.
Q: Why is RPE collected 10 to 50 minutes after the session rather than immediately afterward?
RPE measured immediately after a session tends to be elevated by the acute cardiovascular response and the discomfort of the final effort, which may not represent the overall perceived demand of the session accurately. Collecting it in the 10-to-50-minute window allows some physiological recovery while the session is still recent. This produces a more stable measure that is more comparable across sessions and between players.
Q: How does the drill book concept work in practice, and how is it maintained?
A drill book is a catalogued collection of exercises with documented average load outputs — the total distance, high-speed running distance, player load, and acceleration count that a given exercise reliably generates under standard conditions. These values are developed from accumulated tracking data: after running a 5v5 on a 40×30-meter pitch many times, the average load profile becomes predictable. The coaching and performance staff can then plan a week using drill combinations expected to produce the target load. After each session, the actual tracked output is compared to the planned estimate, and the book is updated. It is a working document that improves over time as more data becomes available.
Q: How are players who receive limited match minutes kept within an appropriate ACWR range?
Match minutes are load events, and a player who appears for 15 minutes has accumulated much less acute load than one who played 90. Over a season of limited involvement, this can lead to meaningful underloading — players risk deconditioning and may also face greater injury risk when they enter a match after extended inactivity. The compensation protocol addresses this through structured post-match or next-day top-up sessions: repeated high-speed runs calibrated to the individual's fitness benchmarks, with volume proportional to the gap between their match minutes and a full-match equivalent. One top-up session for players below 30 minutes, two for those below 50. This keeps every squad member within a reasonable ACWR range regardless of playing time.
References
Dalen, T., Ingebrigtsen, J., Ettema, G., Hjelde, G.H. and Wisloff, U. (2016) 'Player load, acceleration, and deceleration during forty-five competitive matches of elite soccer', Journal of Strength and Conditioning Research, 30(2), pp. 351–359.
Foster, C., Boullosa, D., McGuigan, M., Fusco, A., Cortis, C., Arney, B.E., Orton, B., Dodge, C., Jaime, S., Radtke, K., van Erp, T., de Koning, J.J., Bok, D., Rodriguez-Marroyo, J.A. and Porcari, J.P. (2021) '25 years of session rating of perceived exertion: historical perspective and development', International Journal of Sports Physiology and Performance, 16(4), pp. 456–460.
Gabbett, T.J. (2016) 'The training-injury prevention paradox: should athletes be training smarter and harder?', British Journal of Sports Medicine, 50(5), pp. 273–280.
Glassbrook, D.J., Fuller, J.T., Alderson, J.A. and Doyle, T.L.A. (2020) 'Measurement of lower-limb asymmetry in professional rugby league: a technical note describing the use of inertial measurement units', PeerJ, 8, e9366.
Gualtieri, A., Rampinini, E., Dello Iacono, A. and Beato, M. (2023) 'High-speed running and sprinting in professional adult soccer: current thresholds definition, match demands and training strategies. A systematic review', Frontiers in Sports and Active Living, 5, 1116293.
Haddad, M., Stylianides, G., Djaoui, L., Dellal, A. and Chamari, K. (2017) 'Session-RPE method for training load monitoring: validity, ecological usefulness, and influencing factors', Frontiers in Neuroscience, 11, 612.
Harper, D.J., Carling, C. and Kiely, J. (2019) 'High-intensity acceleration and deceleration demands in elite team sports competitive match play: a systematic review and meta-analysis of observational studies', Sports Medicine, 49(12), pp. 1923–1947.
Helme, M., Tee, J., Emmonds, S. and Low, C. (2021) 'Does lower-limb asymmetry increase injury risk in sport? A systematic review', Physical Therapy in Sport, 49, pp. 204–213.
Impellizzeri, F.M., Ward, P., Coutts, A.J., Bornn, L. and McCall, A. (2020a) 'Training load and injury part 1: the devil is in the detail — challenges to applying the current research in the training load and injury field', Journal of Orthopaedic and Sports Physical Therapy, 50(10), pp. 574–576.
Impellizzeri, F.M., McCall, A., Ward, P., Bornn, L. and Coutts, A.J. (2020b) 'Training load and its role in injury prevention, part 2: conceptual and methodologic pitfalls', Journal of Athletic Training, 55(9), pp. 893–901.
Lolli, L., Batterham, A.M., Hawkins, R., Kelly, D.M., Strudwick, A.J., Thorpe, R., Gregson, W. and Atkinson, G. (2017) 'Mathematical coupling causes spurious correlation within the conventional acute-to-chronic workload ratio calculations', British Journal of Sports Medicine, 53(15), pp. 921–922.
Murray, N.B., Gabbett, T.J., Townshend, A.D. and Blanch, P. (2017) 'The use of relative speed zones in Australian football: are we really measuring what we think we are?', International Journal of Sports Physiology and Performance, 12(6), pp. 701–709.
Rago, V., Brito, J., Figueiredo, P., Mota, J., Rebelo, A. and Krustrup, P. (2020) 'Internal training load monitoring in professional football: a systematic review of methods using rating of perceived exertion', Journal of Sports Medicine and Physical Fitness, 60(6), pp. 928–938.
Tarakci, S., Altun, M., Karakoc, B. and Tüncel, Ö. (2025) 'Running symmetry in professional football: are we measuring what matters?', Gazi Beden Eğitimi ve Spor Bilimleri Dergisi, 30(1), pp. 1–12.

Prof. Dr. Barış Gürol is a faculty member in the Department of Coaching Education at the Faculty of Sports Sciences, Eskişehir Technical University, Turkey. He also serves as the faculty member in charge of the university's Human Performance Laboratory. He holds a doctorate in Movement and Training Sciences and has authored over 25 national and international articles. Throughout his career, he has worked as an Athletic Performance coach for various Turkish Football Super League teams, including Eskişehirspor, Adana Demirspor, Akhisarspor, Erzurumspor, and Beşiktaş JK. His research interests include athlete performance, training load monitoring via GPS systems, football-specific performance testing, and strength training.


Comments